The EMBAC Center for Research collaborated with Northern SPI and Percept Research in 2023 to design a benchmarking dashboard based on the annual industry benchmarking survey.
The EMBAC Benchmarking Research Dashboard is provided by the EMBAC as an interactive tool to help academic members evaluate market trends and program performance based on the annual benchmarking survey.
The Phase 1 initial build included data provisioning, data hygiene, user experience (UX) design, and establishing an architecture for ongoing data transformation for future dashboards. Phase 1 included 13 visualizations (pages) within a Power BI Dashboard for metrics captured in the EMBAC Program Survey.
The 13 pages are:
- Intro - background on the Dashboard along with links to FAQs and support
- Class Profile Cost - Demographic comparison to peer segments as defined by cost band
- Class Profile Region - Demographic comparison to peer segments as defined by region
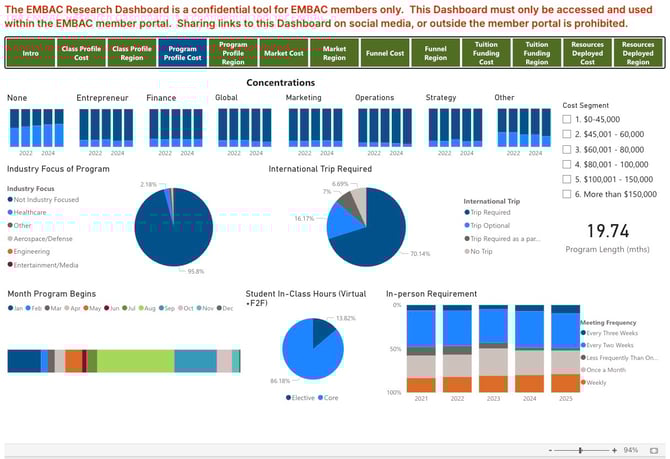
- Program Profile Cost - Program delivery profile (length, frequency, technology, nonacademic services) comparison to peer segments as defined by cost band.
- Program Profile Region - Program delivery profile (length, frequency, technology, nonacademic services) comparison to peer segments as defined by region.
- Market Cost - Market and market share comparison (total students) comparison to peer segments as defined by cost band.
- Market Cost - Market and market share comparison (total students) comparison to peer segments as defined by region.
- Funnel Cost - Admissions funnel performance (Tornado chart) compared to peer segments as defined by cost band.
- Funnel Region - Admissions funnel performance (Tornado chart) compared to peer segments as defined by region.
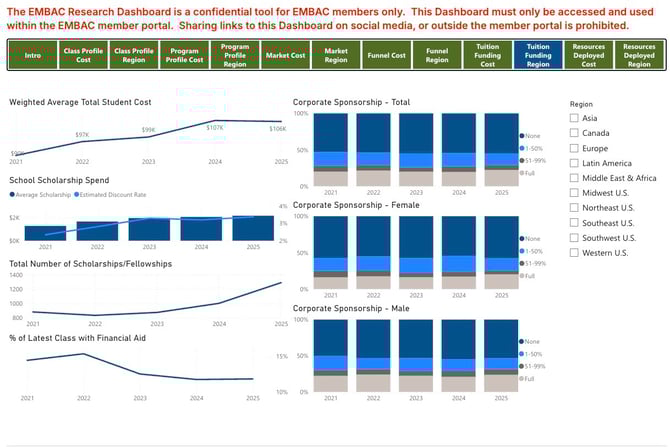
- Tuition Funding Cost - Student tuition funding sources (out-of-pocket, company sponsorship, program scholarship) comparison to peer segments as defined by cost band.
- Tuition Funding Region - Student tuition funding sources (out-of-pocket, company sponsorship, program scholarship) comparison to peer segments as defined by region.
- Resources Deployed Cost - Resource comparison (budget expenditures, staff size) to peer segment as defined by cost band.
- Resources Deployed Region - Resource comparison (budget expenditures, staff size) to peer segments as defined by region.
The EMBAC Research Dashboard is offered as an incentive for academic members to complete the annual Membership Program Survey. This survey powers the dashboard and the EMBAC benchmarking reports.
Percept Research hosts the Dashboard in Microsoft Power BI and facilitates the onboarding process for EMBAC academic members.
If you have questions about using the Dashboard or participating in the annual benchmarking survey, please contact Percept Research here: 👉 https://link.bschoolresear.ch/EMBACsupport
Reference articles:
What is Power BI and how do I access the EMBAC Dashboard?
Why does the EMBAC Dashboard not match the EMBAC Program Survey reports?
If you need assistance in accessing the EMBAC Program Survey Dashboard, please submit a support ticket here: https://link.bschoolresear.ch/EMBACsupport